Analysing CRM data is a great use of Tableau, and ACT from Sage is one of the most commonly used CRM applications. This posts hopes to explain how to get started analysing data from ACT! databases using Tableau.
This is a ‘getting started’ post! I intend to explain how to analyse data from ACT! which has first been extracted into Excel, rather than by making a direct connection to the database.
STEP 1 – Choose an entity from ACT to analyse, and setup ACT appropriately
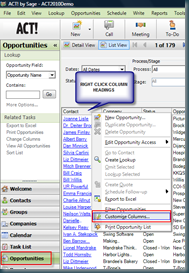
Lets start with ‘Opportunities’. Go to the opportunities view  in ACT as shown here, and then right click the column headings. Select ‘Customise Columns’.
In the dialog presented, select all the available fields and move them to the list box on the right.
This will allow extraction of all the fields into an EXCEL spreadsheet which can later be analysed using Tableau.
STEP 2 – Export the opportunity list from ACT! to EXCEL
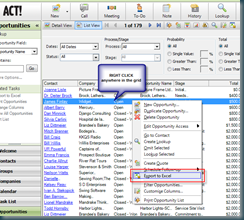
 Exporting the data is as simple as right clicking anywhere on the grid, and selecting the appropriate function.
NOTE – The EXCEL file created by ACT! has two additional sheets which cause problems with Tableau and must be deleted, delete the ‘Opportunities Pivot Chart’ sheet, and ‘Opportunities Pivot’ sheets.
SAVE the EXECL sheet.
STEP 3 – Now we’re ready to analyse this data using Tableau!
This post is not intended to be a training course on Tableau however, there is another post here which should help. But here are some simple steps to get started analysing opportunities from ACT!
PIPELINE DISTRIBUTION by ‘Stage’
- Connect to the spreadsheet using the ‘Connect to Data’ option
- Highlight ‘Total’ and ‘Stage’ in the data window to the left (use the Ctrl key to highlight them both
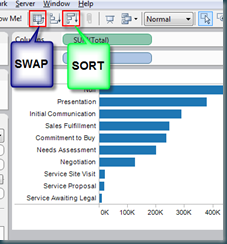
- Hit ‘Show Me’ and select ‘Aligned Bar’ as in the image below
4. Swap the axis and rank the categories using the toolbar buttons in the image below
And there you have it, a ranked bar by sales stage of data from ACT!
What’s next?
This is obviously the first part of a longer story. There are endless ways to rapidly analyse data using Tableau, and many other entities in ACT! which can be analysed.
In addition, the next stage is also to connect Tableau directly into the ACT! database to remove the need for the EXCEL step – this will be the focus of a post for another day!


No comments:
Post a Comment